Navigating The Storm: What Geopolitical Risk Means for Your Asset Allocation
March 26, 2026
CA Harshul Chopra
Assistant Manager
Geopolitical risk is no longer a distant variable that investors can afford to treat as background noise. From the Russia-Ukraine war in 2022 to the Israel-Hamas conflict in 2023, and now the escalating US-Iran tensions in early 2026, the frequency and severity of global flashpoints has intensified dramatically. For Indian investors, this is a question that demands rigorous, data-driven answers — not because India is always directly involved, but because the transmission mechanisms are swift, powerful, and often underestimated.
This edition of Market Intelligence examines how geopolitical shocks have historically impacted Indian markets, which asset classes have provided genuine protection, and what allocation framework Indian investors should consider building into their portfolios — not as a reactive measure, but as a structural discipline.
- HOW GEOPOLITICAL RISK REACHES INDIAN MARKETS
India’s economic exposure to global conflict operates through four primary channels, each with distinct implications for specific asset classes and sectors.
Transmission Channel | Key Risk for India | Primarily Affects |
|---|---|---|
Crude Oil Prices | India imports ~85% of crude needs | INR, inflation, OMCs, aviation, FMCG |
Currency (INR/USD) | Dollar strengthens in risk-off; INR weakens | Import costs, FII flows, corporate margins |
FII Capital Flows | FIIs exit emerging markets in risk-off phases | Nifty, banking, large-cap equities |
Supply Chains / Trade | Red Sea, Hormuz disruptions raise freight | Exporters, logistics, metals |
The West Asian conflict is particularly acute for India because the Strait of Hormuz handles approximately 20% of global oil transportation. Any sustained disruption has an almost immediate pass-through to domestic fuel prices, inflation expectations, and the Reserve Bank of India’s monetary policy stance — a chain that quickly filters into rate-sensitive sectors like banking and real estate.
- WHAT HISTORY TELLS US: CRISIS-BY-CRISIS PLAYBOOK
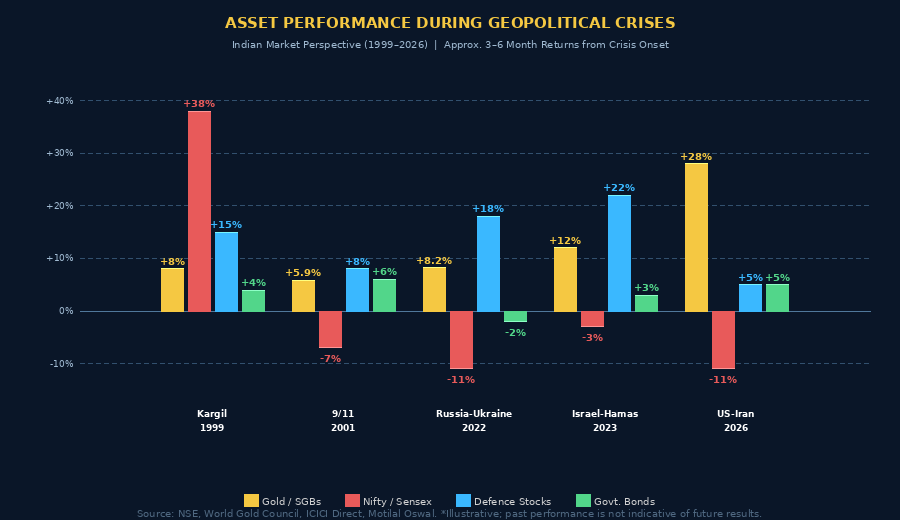
An analysis of every major geopolitical crisis touching Indian markets since 1999 reveals a consistent pattern: short-term pain, but a durable recovery — provided one’s asset allocation is structured to absorb the initial shock. The infographic below maps approximate 3-6 month asset class returns following crisis onset.
Source: Compiled from NSE data, ICICI Direct Research, World Gold Council, Motilal Oswal, Swastika Research. Past performance is not indicative of future results.
The Kargil War (1999): India’s Counterintuitive Resilience
The most striking historical data point is also the least expected. Despite an active armed conflict on Indian soil, the Sensex rose approximately 38% during the Kargil War, driven by investor confidence that the conflict would remain contained and that India’s democratic institutions would prevail. Gold gained a modest 8%, while defence-linked equities appreciated roughly 15%. The key insight: proximity to conflict does not automatically translate into market collapse when fundamentals remain sound.
Post-9/11 (2001): Global Risk-Off, Gold Shines
The September 11 attacks triggered a genuine global risk-off episode. Indian equities fell approximately 7% in the immediate aftermath as FIIs accelerated selling. However, gold gained 5.9% in INR terms, government bonds returned 6%, and the market had recovered within six weeks. The takeaway for Indian investors: in externally driven crises, the short-term correction is typically sharp but brief, and liquidity deployment during the drawdown historically proves rewarding.
Russia-Ukraine War (2022): The Commodity Shock Template
This crisis is the most relevant template for understanding India’s structural vulnerability. FIIs sold nearly ₹70,000 crore in a single month, dragging the Nifty down approximately 11% from near 18,000. The rupee depreciated sharply. Crude oil spiked, stoking inflation and complicating RBI’s rate path. Yet three asset classes delivered positive real returns: gold (approximately +8.2% from crisis onset), defence-sector equities (approximately +18%), and government bonds (which held value as RBI managed liquidity). Within 30 days of the trough, short-covering and fresh FII inflows reversed much of the decline.
Israel-Hamas War (2023) and US-Iran Escalation (2026)
The more recent episodes reinforce the pattern. During the Israel-Hamas conflict, the Nifty corrected around 3% while gold surged approximately 12% and Nifty India Defence Index stocks gained over 22%. In the current US-Iran conflict in early 2026, gold prices — already elevated — have surged a remarkable 28% year-to-date, while the Nifty 50 has shed approximately 11%. The World Gold Council, in its March 2026 report, notes that gold has emerged as one of the strongest-performing assets in recent years, outperforming equities, bonds, and currencies as investors seek protection against geopolitical tensions and inflation risks.
- ASSET ALLOCATION STRATEGIES THAT HAVE PROVEN RESILIENT
Strategy 1: The Geopolitical-Aware Core-Satellite Portfolio
A core-satellite framework separates long-term structural holdings (core) from tactical tilts around specific risk events (satellite). In geopolitical uncertainty, the core should hold assets that are negatively correlated with equities — gold being the primary instrument — while the satellite captures tactical opportunities in defence, energy upstream, and select exporters (IT companies that benefit from dollar appreciation).
Portfolio Layer | Allocation | Instruments | Geopolitical Role |
|---|---|---|---|
Core — Equity | 45–50% | Large-cap diversified / Nifty 50 index | Long-term wealth creation |
Core — Gold | 10–15% | SGBs, Gold ETFs, Gold MFs | Safe-haven anchor |
Core — Bonds | 15–20% | Govt. bonds, Gilt Funds, PSU bond funds | Stability / deflation hedge |
Satellite — Defence | 5–8% | BEL, HAL, BDL, MTAR, Nifty Defence ETF | Direct crisis beneficiary |
Satellite — Exporters | 5% | IT large-caps, pharma exporters | INR depreciation hedge |
Liquidity Buffer | 5–10% | Liquid funds, T-bills, overnight funds | Dry powder for dip buying |
Why 10–15% Gold Is Non-Negotiable for Indian Investors ▸ World Gold Council recommends a strategic gold allocation of 7.5–15% to improve risk-adjusted returns for Indian portfolios (2026 report). ▸ A depreciating INR amplifies domestic gold returns — when the rupee falls, gold in INR terms rises further, providing a double layer of protection. ▸ Over a 19-year analysis period, an average INR portfolio delivered higher risk-adjusted returns and lower drawdowns with gold allocations in this range. ▸ Every 100-unit increase in the Geopolitical Risk (GPR) Index corresponds to approximately a 2.5% rise in the gold price (World Gold Council GRAM model). |
Strategy 2: The 60/20/20 Framework — Beyond the Broken 60/40
The traditional 60/40 equity-bond portfolio, which relied on negative correlation between the two asset classes for downside protection, has been significantly eroded since 2022. Rising equity-bond correlations — where both assets sell off simultaneously during inflationary geopolitical shocks — have undermined this framework. LSEG/FTSE Russell research demonstrates that a 60/20/20 portfolio (equity/bonds/gold) began to outperform the traditional 60/40 from the COVID-19 period onward, and more decisively after 2022 when equity-bond correlations rose sharply. For Indian investors, this is not merely theoretical: the 2022 episode, when both the Nifty and bond funds faced headwinds simultaneously, validated this reallocation thesis.
Strategy 3: SIP Continuity with Tactical Top-Ups
Historical data across six major geopolitical episodes between 1990 and 2026 shows that the Sensex delivered average returns of approximately 28% over the three months following a crisis-driven market correction, and approximately 38% over six months. This data makes the case not for panic-driven selling — which locks in losses — but for disciplined SIP continuity coupled with tactical lump-sum deployment during the dip phase. The investors who exited equities during the Kargil War, post-9/11, or at the onset of Russia-Ukraine all underperformed significantly relative to those who maintained or increased their positions.
Strategy 4: Sector Rotation — Knowing What Wins and What Suffers
Not all sectors respond uniformly. Investors who understand the sectoral playbook during geopolitical crises can tactically tilt without abandoning their core allocation.
Sector | Geopolitical Impact | Tactical Action |
|---|---|---|
Defence (BEL, HAL, BDL) | Strong Positive | Overweight tactically |
Upstream Oil (ONGC, Oil India) | Positive | Add selectively |
IT / Software Exporters | Mild Positive (INR benefit) | Hold / Add on dips |
Pharma Exporters | Mild Positive (defensive) | Hold |
Aviation | Negative (ATF cost spike) | Reduce exposure |
Oil Marketing Companies | Negative (margin compression) | Underweight |
FMCG (input cost pressure) | Mild Negative | Hold / Monitor |
Auto (import-heavy) | Negative (currency + input costs) | Reduce |
- KEY RISK INDICATORS EVERY INDIAN INVESTOR SHOULD MONITOR
Effective geopolitical risk management requires tracking a specific set of macro indicators that act as early-warning signals. These are the variables that tend to move ahead of broader market stress becoming apparent.
The Geopolitical Dashboard — Watch These 5 Indicators 01 Brent Crude Price: India’s primary vulnerability. Prices sustained above $90/barrel historically trigger rupee depreciation, RBI policy tightening, and broad equity weakness. Monitor weekly. 02 INR/USD Exchange Rate: A weakening rupee signals FII outflows and import cost stress. Below 84 is manageable; sustained weakness beyond 87-88 warrants defensive repositioning. 03 India VIX: India’s fear index. Spikes above 20 signal elevated short-term risk and have historically coincided with the best medium-term buying opportunities for patient investors. 04 FII Net Flows (Monthly): Sustained FII selling of ₹20,000+ crore per month creates meaningful market headwinds. Track NSE/SEBI data weekly. 05 Geopolitical Risk (GPR) Index: A global measure of geopolitical stress. Historically, every 100-point rise corresponds to approximately 2.5% gold appreciation and notable equity market pressure. |
- THE BEHAVIORAL IMPERATIVE: WHY DISCIPLINE OUTPERFORMS PREDICTION
The single largest return drag for Indian investors during geopolitical crises is not the crisis itself — it is behavioral error. Panic selling at market troughs, abandoning SIPs mid-crisis, and chasing defensive assets after they have already rallied are the three patterns that consistently erode long-term wealth. The data is unambiguous: markets have bounced back from every geopolitical shock in India’s investment history. The Sensex, which stood at approximately 5,000 during the Kargil War, has compounded to over 75,000 today — a journey that included multiple wars, terror attacks, pandemics, and financial crises.
The appropriate investor response is not prediction — no one consistently forecasts the timing, duration, or severity of geopolitical events. The appropriate response is preparation: a structurally diversified portfolio, a pre-defined rebalancing discipline, adequate liquidity reserves to exploit market dislocations, and the psychological framework to act counter-cyclically when fear peaks.
EDITOR’S SUMMARY Geopolitical risk is permanent, but it is not paralyzing — if your portfolio is built for it. Maintain a strategic gold allocation of 10–15% via SGBs or Gold ETFs. Replace the 60/40 framework with a 60/20/20 structure that includes gold. Keep 5–10% in liquid assets as tactical dry powder. Tilt tactically toward defence and upstream energy during elevated risk phases. Monitor Brent crude, the INR, India VIX, and FII flows as your forward indicators. Most importantly: stay invested, stay disciplined, and let historical resilience — not panic — guide your decisions. |